

Introduction
Planning your next flight? You might want to think twice about which airport you’re flying through. A comprehensive November 2025 study by Sail Croatia has identified the world’s most frustrating airports—and four major US hubs made the infamous list. From massive lost luggage problems to overcrowded terminals and significant flight delays, these airports consistently deliver challenging experiences for millions of travelers.
The study analyzed 50 of the world’s busiest international airports using three critical metrics: flight delay percentages, passenger density (crowding), and lost baggage search volumes. Each airport received a frustration score from 0 to 100, with higher scores indicating worse traveler experiences.
While London Stansted Airport claimed the dubious honor of worst airport globally with an astonishing 75.5% flight delay rate, four American airports ranked among the world’s top problem hubs. This comprehensive guide reveals which US airports to avoid (or at least prepare for), what makes them so challenging, and practical strategies to minimize travel stress.
Understanding the Study Methodology
How Airports Were Evaluated
Sail Croatia’s research team analyzed data from 50 major international airports worldwide, focusing on quantifiable metrics that directly impact passenger experience.
Three Key Evaluation Criteria:
- Flight Delay Percentage
- What it measures: Proportion of flights departing later than scheduled
- Why it matters: Delays trigger cascading problems including missed connections, extended wait times, and disrupted travel plans
- Data source: Flight tracking services and airport operational data
- Passenger Density
- What it measures: Number of passengers per square kilometer of terminal space annually
- Why it matters: Overcrowding leads to longer lines, insufficient seating, stressed staff, and chaotic environments
- Calculation: Total annual passengers divided by terminal square footage
- Lost Baggage Search Volume
- What it measures: Annual online searches for help finding lost luggage from that airport
- Why it matters: Indicates systemic baggage handling problems and operational failures
- Data source: Search engine query analysis
Scoring System: Each airport received a composite score from 0-100, with higher numbers indicating more frustrating experiences. The scoring weighted all three factors to create an overall frustration index.
Why These Metrics Matter
According to a Sail Croatia spokesperson: “Air travel used to be expensive and something most people only did once or twice a year. Budget airlines changed that completely about 20 years ago. Passenger numbers have gone from 2 billion to nearly 10 billion today. More people can afford to fly now, which sounds great until you realize airports weren’t built to handle this many passengers.”
This infrastructure mismatch creates the perfect storm for operational problems, particularly at high-traffic American hubs that serve as critical connection points for domestic and international travelers.
The 4 Worst US Airports in 2025
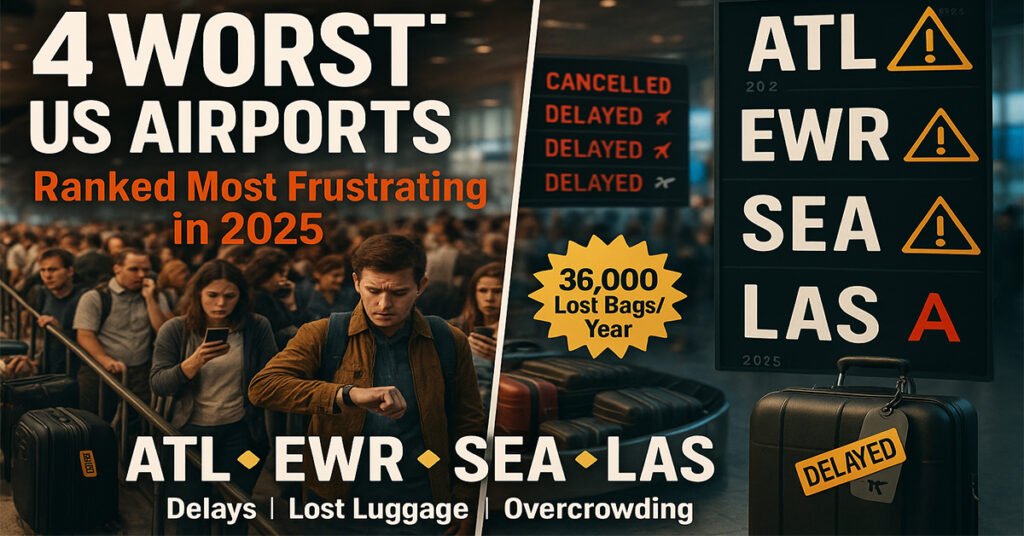
#1: Hartsfield-Jackson Atlanta International Airport (ATL)
Overall Frustration Score: 51.24 (2nd worst globally)
The world’s busiest airport by passenger volume—handling a staggering 108 million travelers annually—faces overwhelming operational challenges that earned it the second-worst ranking worldwide, behind only London Stansted.
Performance Metrics:
- Flight Delays: 21% of flights delayed
- Passenger Density: Extremely high (specific data: crowded terminals despite massive size)
- Lost Baggage Searches: ~36,000 annually (7x higher than next-worst US airport)
Why Atlanta Ranks Worst:
The sheer scale of operations at ATL creates unique challenges. As the primary hub for Delta Air Lines and a major connection point for travelers across the southeastern United States, the airport processes more passengers than any other facility on Earth.
Lost Luggage Crisis: The most alarming statistic is Atlanta’s baggage handling performance. With approximately 36,000 annual searches for lost luggage assistance—roughly seven times higher than the next-worst offender on the list—ATL’s baggage system clearly struggles under the volume.
Recent Operational Issues:
- December 8, 2025: Dense fog caused over 1,500 delays and 200+ cancellations
- November 2025: Government shutdown-related TSA staffing shortages created extensive security line delays
- October 2025: 161 flights delayed in single morning due to staffing issues
Terminal Conditions: Despite having seven concourses and extensive facilities, the airport regularly experiences:
- Overcrowded gate areas during peak hours
- Long security lines (especially during TSA staffing challenges)
- Baggage claim chaos during irregular operations
- Limited seating in many terminal areas
What Travelers Say: “I’ve been in and out of here a bunch of times, but I’ve never seen it this bad,” said Frank Meed, a Delta passenger whose flight was canceled due to weather in December 2025, leaving him waiting hours for his checked bag.
#2: Newark Liberty International Airport (EWR)
Overall Frustration Score: 39.6
As the “third airport” serving the New York metropolitan area (alongside JFK and LaGuardia), Newark faces unique operational challenges including weather-related delays and geographic constraints.
Performance Metrics:
- Flight Delays: 28.9% (nearly 3 in 10 flights delayed)
- Passenger Density: 5.95 million passengers per square kilometer (3rd highest on the list)
- Lost Baggage Searches: 1,400 annually
Why Newark Struggles:
Weather Vulnerability: Newark’s location makes it particularly susceptible to weather-related delays. The New York airspace is among the most congested in the world, and when weather forces holding patterns or ground stops, Newark often experiences the most severe impacts.
Crowding Challenges: With 5.95 million passengers per square kilometer, Newark ranks third globally for passenger density. The terminals were designed for significantly lower traffic volumes, creating chronic overcrowding during peak travel periods.
Operational Complexity: As one of United Airlines’ major hubs, Newark handles complex international and domestic connection traffic. The airport’s role as a critical East Coast gateway means disruptions ripple across the entire United network.
Terminal Experience:
- Terminal A recently renovated (completed 2022) but remains crowded
- Terminal B partially modernized but still faces capacity constraints
- Terminal C (United’s hub) experiences significant congestion
- Limited dining and seating options in older terminal sections
Delay Factors:
- Frequent air traffic control delays due to NYC airspace congestion
- Weather delays from nor’easters, summer thunderstorms, and winter storms
- High international traffic requiring complex customs/immigration operations
- Ground traffic congestion affecting aircraft taxi times
#3: Seattle-Tacoma International Airport (SEA)
Overall Frustration Score: 36
Known locally as “SeaTac,” this Pacific Northwest hub has emerged as one of America’s most frustrating airports despite its regional reputation as a secondary player compared to global giants.
Performance Metrics:
- Flight Delays: 20.98% (about 1 in 5 flights delayed)
- Passenger Density: 5.16 million passengers per square kilometer
- Lost Baggage Searches: 2,800 annually (double Las Vegas’s volume)
Why SeaTac Underperforms:
Rapid Growth Without Infrastructure: Seattle-Tacoma has experienced explosive passenger growth over the past decade, driven by Seattle’s booming tech economy and Alaska Airlines’ hub operations. The airport now handles over 50 million passengers annually—far exceeding its original design capacity.
Crowding Crisis: With 5.16 million passengers per square kilometer, travelers report being “squeezed into tight spaces” throughout the terminal. The airport’s configuration creates bottlenecks, particularly during peak departure times.
Lost Luggage Issues: SeaTac’s 2,800 annual lost baggage searches—double that of Las Vegas—indicate significant baggage handling operational problems. The high rate relative to passenger volume suggests systemic issues with baggage tracking and delivery.
Terminal Challenges:
- Single-terminal design creates chokepoints
- Limited gate capacity forces remote parking positions
- Security checkpoint congestion during morning departures
- Insufficient baggage claim capacity during peak arrivals
Expansion Efforts: Seattle-Tacoma is undergoing significant expansion, including a new international arrivals facility. However, construction disruptions add to current traveler frustrations, and completed improvements won’t materialize for several years.
#4: Harry Reid International Airport (LAS)
Overall Frustration Score: 34.90
Las Vegas’s primary airport serves as a gateway to one of America’s top tourism destinations, creating unique operational challenges.
Performance Metrics:
- Flight Delays: 21.6% (slightly higher than Atlanta and Seattle)
- Passenger Density: 5.16 million passengers per square kilometer (tied with Seattle)
- Lost Baggage Searches: 1,400 annually
Why Las Vegas Challenges Travelers:
Weekend Surge Problem: Unlike business-focused airports with weekday peaks, Las Vegas experiences extreme weekend surges as tourists flood in Thursday through Sunday and depart Sunday through Monday. This creates severe capacity constraints during specific timeframes.
Leisure Traveler Dynamics: The airport predominantly serves leisure travelers who may be less experienced with air travel processes, potentially contributing to longer security lines and boarding delays.
Terminal Configuration: Terminal 1 and Terminal 3 (formerly named T1 and T3) operate somewhat independently, with Terminal 1 handling Southwest and ultralow-cost carriers while Terminal 3 serves most other airlines. This split configuration can create confusion and uneven crowding.
Heat and Weather: Summer temperatures regularly exceed 110°F, affecting aircraft performance and creating operational constraints. High winds are also common, particularly in spring, causing ground stops and delays.
Recent Improvements: The airport has invested significantly in modernization, including renovated baggage systems and terminal upgrades. However, passenger density remains a significant challenge, particularly during peak vacation periods.
Global Context: How US Airports Compare
The World’s 10 Worst Airports (2025)
- London Stansted (UK) – Score: 64.80
- 75.5% flight delays (worst globally)
- 28 million passengers in compact terminals
- Hartsfield-Jackson Atlanta (USA) – Score: 51.24
- World’s busiest airport
- Catastrophic lost luggage numbers
- Charles de Gaulle (France) – Score: ~50
- 62.1% flight delays
- Serves 70 million passengers annually
- London Gatwick (UK) – Score: ~49
- 43+ million passengers
- 30.7% flight delays
- London Heathrow (UK) – Score: 48.33
- Europe’s busiest: 84 million passengers
- 24.6% flight delays
- Newark Liberty (USA) – Score: 39.6
- Seattle-Tacoma (USA) – Score: 36
- Harry Reid Las Vegas (USA) – Score: 34.90
- Madrid-Barajas (Spain) – Score: 35.89
- 44.4% flight delays
- Vienna International (Austria) – Score: ~35
- Significant delay issues
UK Dominates Problem Airports
A striking finding: Three of the top five worst airports globally are in the United Kingdom. The UK’s aging aviation infrastructure, combined with Brexit-related operational changes and explosive post-pandemic travel demand, has created a perfect storm of delays and overcrowding.
Why Are These Airports Struggling?
Infrastructure vs. Demand Mismatch
The fundamental problem facing all four US airports is simple: they’re processing passenger volumes far exceeding their designed capacity.
Historical Context:
- 2000: ~2 billion global air passengers annually
- 2025: ~10 billion global air passengers annually
- Airport infrastructure: Largely unchanged or incrementally expanded
The Budget Airline Revolution: Beginning around 2005, low-cost carriers made air travel affordable for millions more Americans. Southwest, Spirit, Frontier, and other budget airlines democratized flying—but airports built in the 1970s-1990s weren’t designed for this volume.
Staffing Shortages
Recent government shutdowns and industry-wide labor shortages have exacerbated existing problems:
TSA Staffing:
- October-November 2025: Multiple US airports experienced severe security delays
- Unpaid workers during shutdowns call out sick
- Checkpoint closures force remaining staff to handle overflow
Air Traffic Control:
- FAA facilities around Atlanta, Southern California, Chicago, and Las Vegas reported ATC shortages
- Delays ripple through entire national airspace system
Airline Ground Staff:
- Baggage handlers, gate agents, and ramp workers in short supply
- Higher workload per employee increases error rates
- Contributes to lost luggage and delayed flights
Weather and Geographic Factors
Atlanta: Frequent afternoon thunderstorms in summer, occasional winter ice/snow Newark: Northeast weather patterns, congested NYC airspace Seattle: Marine layer fog, mountain wave turbulence, winter storms Las Vegas: Extreme heat, high winds, occasional flash flooding
Connecting Hub Dynamics
All four airports serve as major connection hubs, creating complex operational challenges:
- Tight connection times mean delays cascade
- Baggage must be transferred between flights
- Weather at one hub affects travelers nationwide
- Hub-and-spoke model concentrates risk
Practical Survival Strategies for Flying Through Problem Airports
Before You Book
Choose Alternatives When Possible:
- Instead of ATL: Consider Nashville (BNA) or Charlotte (CLT) for southeastern connections
- Instead of EWR: Try Philadelphia (PHL) or smaller regional airports like Westchester County (HPN)
- Instead of SEA: Portland (PDX) may offer alternatives for Pacific Northwest travel
- Instead of LAS: Consider flying into Burbank (BUR) or Ontario (ONT) for Southern California destinations with Vegas as side trip
Book Strategic Flight Times:
- Early morning flights (before 7 AM) experience fewer delays
- Avoid afternoon departures at Atlanta and Las Vegas (thunderstorm/heat issues)
- Skip Sunday evenings at Las Vegas (peak leisure return travel)
- Midweek travel generally smoother than Thursday-Monday at all hubs
Build in Buffer Time:
- Minimum 3-hour connections at ATL and EWR
- Minimum 2.5-hour connections at SEA and LAS
- Consider overnight layovers for critical travel (weddings, cruises, international connections)
At the Airport
Arrive Earlier Than Usual:
- Domestic flights: 2.5-3 hours before departure
- International flights: 3.5-4 hours before departure
- During government shutdowns or staff shortages: Add 30-60 minutes
TSA PreCheck and CLEAR: Absolutely essential at these problem airports. The investment pays for itself in a single trip:
- TSA PreCheck: $78-85 for 5 years (~$16/year)
- CLEAR: $189/year (often discounted with credit card benefits)
- Combined: Bypass majority of security line chaos
Pack Smart:
- Carry-on only eliminates lost luggage risk entirely
- If checking bags: Photograph your luggage and use AirTags/Tile trackers
- Keep medications, valuables, and change of clothes in carry-on
Use Airline Apps:
- Download before travel for real-time gate changes
- Enable push notifications for flight updates
- Mobile boarding passes eliminate ticket counter lines
Know Your Terminal:
- Study airport maps before arriving
- Locate your gate area, dining options, and alternative gates for irregular operations
- Download airport-specific apps (ATL has one, SEA offers one, etc.)
During Delays and Disruptions
Act Quickly:
- Call airline customer service while standing in airport line
- Use airline app to rebook simultaneously
- Gate agents can often help faster than general customer service
Know Your Rights:
- Airlines must rebook you on next available flight (even competitors) if delay is their fault
- You’re entitled to meal vouchers for significant delays
- Hotel accommodation required for overnight delays due to airline issues (not weather)
Document Everything:
- Photograph delay boards and announcements
- Save all receipts for delay-related expenses
- Take screenshots of flight status updates
Consider Alternative Transportation:
- Rental car for shorter distances (Newark to Philadelphia, Las Vegas to Los Angeles, etc.)
- Amtrak for East Coast connections
- Cancel and rebook entirely if delay exceeds several hours
Lost Luggage Prevention and Response
Prevention:
- Use distinctive luggage tags and colorful straps for easy identification
- Place contact information inside and outside bags
- Photograph your luggage before checking
- Use tracking devices (AirTag, Tile) in checked bags
If Your Bag Is Lost:
- Report immediately at airport baggage claim office (don’t leave airport)
- Get written report with claim number
- File online claim through airline website for redundancy
- Use tracking device to provide airline with bag location
- Request delivery to your destination (hotels accept baggage deliveries)
- Keep receipts for essential replacement items (airlines reimburse necessities)
Follow Up:
- Airlines must compensate for lost bags (up to $3,800 for domestic flights)
- Essential replacement items usually covered immediately
- Be persistent—squeaky wheels get faster service
Airport-Specific Tips and Insider Knowledge
Hartsfield-Jackson Atlanta (ATL)
Best Practices:
- Use domestic Terminal South for Delta, Main Terminal for other airlines
- Take the Plane Train between concourses (don’t walk—it’s exhausting)
- Dining: Better options on Concourses B, C, and E
- Parking: Use economy lot with shuttle (significant savings vs. hourly)
Insider Tips:
- Morning flights (before 9 AM) have best on-time performance
- Afternoon thunderstorms peak 2-5 PM (avoid arrivals/departures)
- Friday afternoons are absolutely brutal—avoid if possible
- Delta Sky Club access valuable for delays (purchase day pass if needed)
If Things Go Wrong:
- Delta’s customer service desks on every concourse
- International Terminal has quieter rebooking area
- Consider hotel at airport for overnight delays (several connected via Plane Train)
Newark Liberty (EWR)
Best Practices:
- Terminal A is newest and most modern (smaller airlines)
- Terminal C (United hub) can be most crowded—arrive early
- Use AirTrain to connect terminals if needed
- Parking: Book off-site lots in advance for significant savings
Insider Tips:
- Morning fog often clears by 10 AM—later flights have better performance
- Winter nor’easters cause 12+ hour delays—monitor weather religiously
- United’s customer service better at Terminal C than phone
- PATH train to Manhattan offers alternatives to expensive taxis
If Things Go Wrong:
- Newark has excellent rail connections to NYC—consider abandoning flight for train
- Multiple hotels within 5-10 minutes of airport
- United Club (Terminal C) often has customer service agents who can help faster
Seattle-Tacoma (SEA)
Best Practices:
- Arrive at north or south ends of terminal first, then walk to gate (less crowded security)
- Central Terminal security most crowded—avoid if possible
- Download SEA app for real-time security wait times
- Light rail to downtown Seattle is convenient and cheap ($3)
Insider Tips:
- Marine layer fog usually clears by 11 AM
- Alaska Airlines dominates—their customer service generally responsive
- Concourse C and D have best dining options
- Winter weather delays often affect morning flights
If Things Go Wrong:
- Alaska Lounge (even if you’re not flying Alaska) may accommodate stranded travelers for a fee
- Several airport hotels connected via free shuttle
- Consider driving to Portland (PDX) for alternative flights (3 hours)
Harry Reid Las Vegas (LAS)
Best Practices:
- Terminal 1 serves Southwest and budget carriers (often more crowded)
- Terminal 3 serves major carriers (Delta, United, American, international)
- Use rideshare pickup areas (cheaper than taxis)
- Avoid Sunday and Monday departures when possible
Insider Tips:
- Early morning flights avoid heat-related delays
- Spring wind delays most common March-May
- Terminal 3 has significantly better dining and shopping
- Free Wi-Fi is reliable throughout airport
If Things Go Wrong:
- Las Vegas hotels often have discounted rates—overnight delay might be affordable
- Multiple airlines serve Las Vegas—rebooking alternatives usually available
- Consider rental car to Southern California if delays exceed 4 hours (4-5 hour drive)
When to Consider Travel Insurance
Situations Where Insurance Makes Sense
High-Stakes Travel:
- Non-refundable cruise departures
- International trips with expensive pre-paid components
- Weddings, reunions, or other time-critical events
- Travel during peak seasons (Thanksgiving, Christmas, spring break)
Connection Through Problem Airports:
- Flying through ATL, EWR, SEA, or LAS with tight connections
- Multi-leg itineraries where one delay cascades
- International travel requiring connection through these hubs
What to Look For:
- “Cancel for Any Reason” (CFAR) coverage: Provides 50-75% reimbursement
- Trip delay coverage: Reimburses meals and hotels after specified delay period (usually 6-12 hours)
- Baggage delay coverage: Provides funds for essential purchases if bag is delayed 12+ hours
- Missed connection coverage: Pays for alternative transportation or overnight stays
Recommended Providers:
- Travel Guard
- Allianz Travel Insurance
- World Nomads (for international travel)
- Squaremouth (comparison shopping)
Cost: Typically 4-10% of total trip cost. A $3,000 trip might cost $120-300 to insure.
The Best US Airports for Comparison
While we’ve focused on problem airports, it’s worth noting which US airports excel:
Top-Performing US Airports (Lower Frustration):
- Salt Lake City International (SLC)
- Modern terminal opened 2020
- Efficient operations
- Lower passenger density
- Phoenix Sky Harbor (PHX)
- Good weather reliability
- Well-designed terminals
- Efficient Southwest hub
- Tampa International (TPA)
- Consistently rated highly for customer experience
- Efficient layout
- Good on-time performance
- Portland International (PDX)
- Manageable size
- Regional focus reduces complexity
- Good weather most of year
- San Diego International (SAN)
- Smaller size
- Excellent weather
- Efficient operations
What They Do Right:
- Appropriate capacity for passenger volumes
- Investment in modern baggage systems
- Efficient terminal layouts
- Strategic use of technology
- Better weather conditions (SLC’s snow operations are exceptional)
Future Outlook: Will Things Improve?
Planned Improvements at Problem Airports
Atlanta (ATL):
- Terminal modernization ongoing
- Enhanced baggage systems being implemented
- Additional concourse capacity under consideration
Newark (EWR):
- Terminal A renovation complete (2022)
- Terminal B modernization continuing
- Terminal C renovations planned
Seattle-Tacoma (SEA):
- New international arrivals facility under construction (completion expected 2027)
- Additional gates being added
- Baggage system upgrades planned
Las Vegas (LAS):
- Ongoing terminal improvements
- Enhanced baggage tracking systems
- Additional gate capacity being evaluated
Realistic Expectations
While these improvements will help, fundamental challenges remain:
- Construction disruptions create short-term problems
- Passenger growth continues to outpace infrastructure expansion
- Staffing shortages persist across aviation industry
- Climate change increases extreme weather events
Bottom Line: Expect gradual improvement over 5-10 years, but these airports will remain challenging during peak periods for the foreseeable future.
Frequently Asked Questions
Which US airport has the worst lost luggage problem?
Hartsfield-Jackson Atlanta International Airport experiences approximately 36,000 annual lost baggage searches—seven times higher than any other US airport on the list. This indicates severe systemic baggage handling issues.
What’s the worst time to fly through these airports?
Afternoon flights (2-6 PM) at Atlanta experience frequent thunderstorm delays. Sunday evenings at Las Vegas see peak leisure travel congestion. Thursday through Monday at all four airports are busiest. Early morning flights (before 7 AM) generally perform best.
Should I avoid connecting through these airports?
If you have flexibility, consider alternative hubs. However, sometimes these airports offer the best pricing or routing. If you must connect, allow minimum 3-hour layovers at Atlanta and Newark, 2.5 hours at Seattle and Las Vegas.
How can I minimize lost luggage risk?
Travel with carry-on only if possible. If you must check bags, use tracking devices (AirTag or Tile), photograph your luggage, and place contact information inside and outside bags. Book direct flights when possible to avoid baggage transfers.
What are my rights if my flight is significantly delayed?
If delays are the airline’s fault (not weather), you’re entitled to rebooking on the next available flight (even on competitors), meal vouchers for delays over 3 hours, and hotel accommodation for overnight delays. Document everything and be persistent.
Is travel insurance worth it for flights through these airports?
For high-stakes travel (cruises, destination weddings, non-refundable international trips), travel insurance with trip delay coverage is highly recommended when connecting through these problem airports. For routine business or flexible leisure travel, it’s less critical.
Can I get compensation for flight delays?
In the US, airlines aren’t required to compensate passengers for delays (unlike EU regulations). However, if delays are airline-caused (not weather), you’re entitled to rebooking, meals, and hotels. Consider credit cards with travel delay protection (typically reimburse expenses after 6-12 hour delays).
What’s the worst month to travel through these airports?
Atlanta: June-August (thunderstorms), Thanksgiving week, Christmas week Newark: January-February (nor’easters), summer thunderstorm season Seattle: November-January (winter storms), July-August (peak travel) Las Vegas: March-May (wind), July-August (heat), December holidays
Are there better alternative airports?
For Atlanta: Charlotte (CLT), Nashville (BNA) For Newark: Philadelphia (PHL), smaller NYC-area options For Seattle: Portland (PDX) for some West Coast travel For Las Vegas: Consider flying into Southern California airports and driving (if suitable for your trip)
How early should I arrive at these airports?
Domestic flights: 2.5-3 hours before departure International flights: 3.5-4 hours before departure Add 30-60 minutes during government shutdowns, peak travel periods, or known staffing issues. TSA PreCheck and CLEAR significantly reduce required buffer time.
Conclusion: Surviving America’s Most Challenging Airports
Flying through Hartsfield-Jackson Atlanta, Newark Liberty, Seattle-Tacoma, or Harry Reid Las Vegas doesn’t have to ruin your trip—but it does require preparation, realistic expectations, and strategic planning.
Key Takeaways:
- These rankings reflect real operational challenges: The Sail Croatia study identifies genuine problems affecting millions of travelers. Take them seriously when planning trips.
- Lost luggage is Atlanta’s biggest issue: With 36,000 annual searches, ATL’s baggage handling deserves special caution. Travel with carry-on only if possible.
- Delays are widespread: All four airports experience 20-29% flight delays. Build buffer time into connections and important travel.
- Infrastructure can’t keep up: Global passenger volumes increased 5x while airport infrastructure grew incrementally. This mismatch drives frustration.
- You have control: Early flights, strategic booking, TSA PreCheck, carry-on luggage, and arrival timing all improve outcomes significantly.
- Alternative airports exist: When flexibility permits, consider other hubs for connections and departures.
- Technology helps: Airline apps, airport apps, flight tracking, and luggage trackers provide information and control during disruptions.
Your Action Plan:
- Download airline apps before travel
- Enroll in TSA PreCheck/CLEAR if you fly more than twice annually
- Arrive earlier than you think necessary
- Pack carry-on only for trips under one week
- Use luggage trackers if you must check bags
- Consider travel insurance for high-stakes trips
- Book early morning flights when possible
- Monitor weather forecasts and adjust plans proactively
Remember: millions of travelers successfully navigate these airports daily. With proper preparation and realistic expectations, you can too. The difference between a nightmare experience and a manageable journey often comes down to planning, flexibility, and maintaining perspective when inevitable delays occur.
Safe travels, and may your luggage always arrive with you!